 Data Visualization
Feature details
Data Visualization
Go from data to publishable figures with code
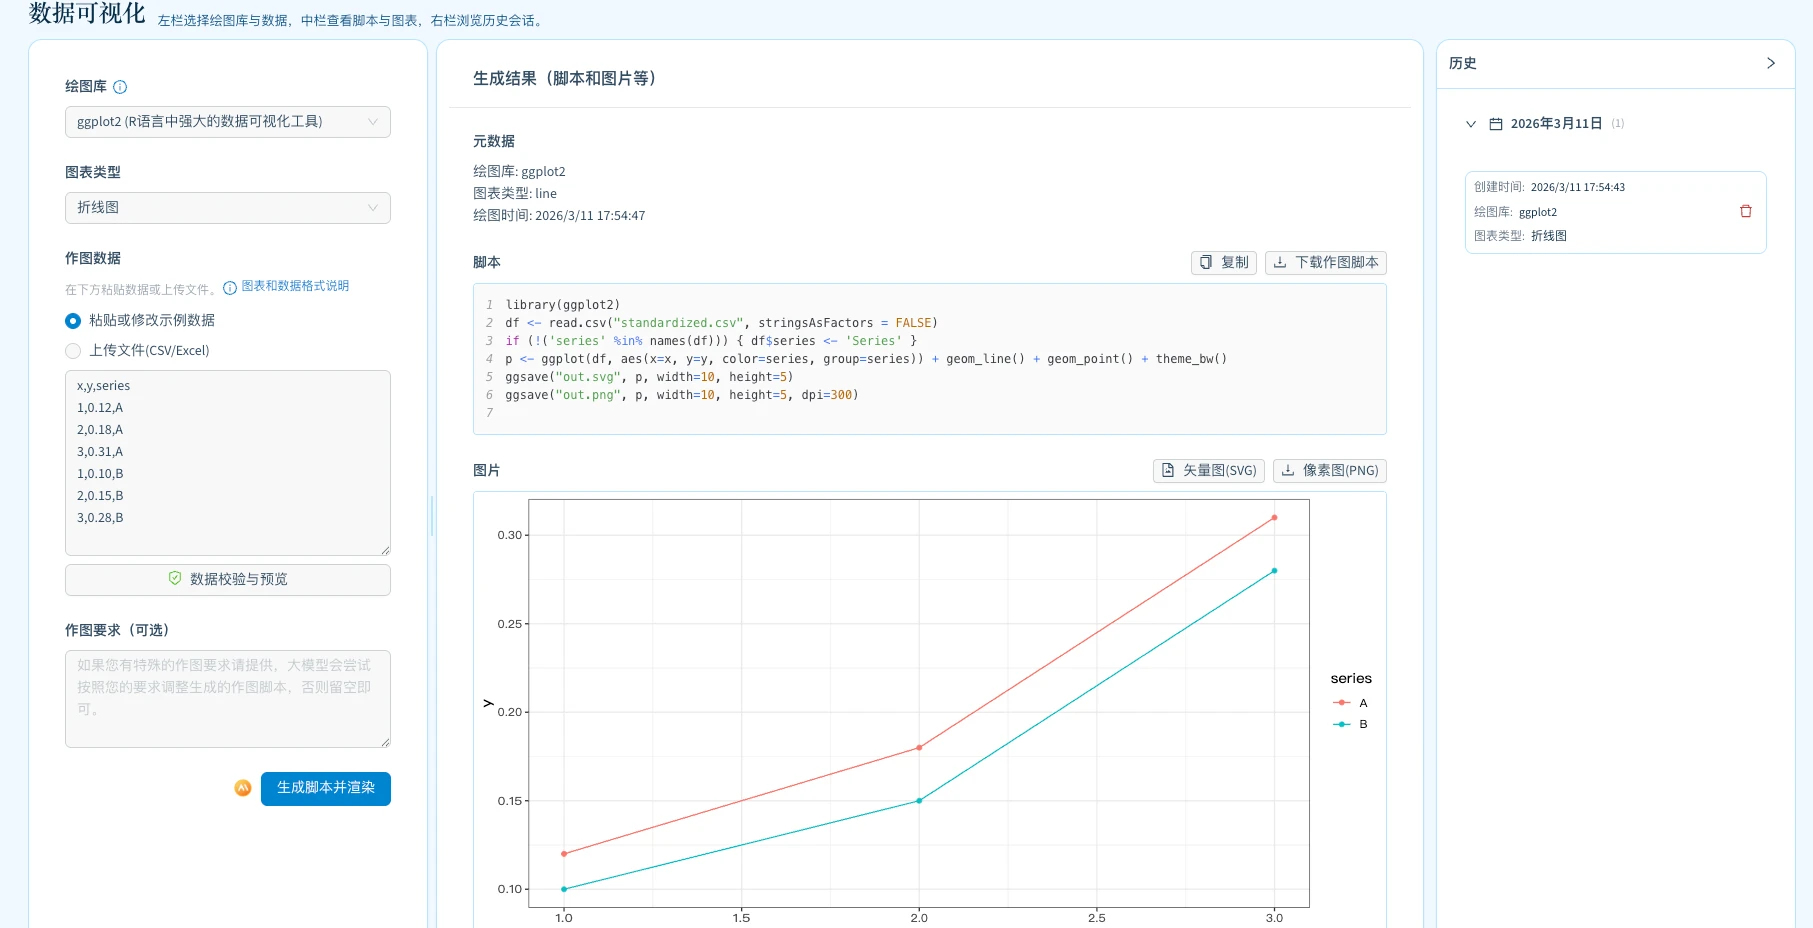
After uploading data, you get not only charts but also reproducible code, making outputs easier to validate, revise, and reuse.
What it helps you do
- Generate common statistical charts from data
- Produce publication-style plots via ggplot2
- Build flow and structure diagrams via Mermaid
- Auto-generate complete reproducible code
- Reduce effort from data processing to final figures
What you will get
- Figures usable in papers and presentations
- Reproducible, editable plotting code
- A clearer and more rigorous data narrative
Highlights
- Output includes both visuals and source code
- Balances communication quality and reproducibility
- Supports statistical, workflow, and method diagrams
How to use
- Upload data or describe your target chart type.
- The system generates charts and corresponding code.
- Refine details, then export figures and scripts.